Sigma computing sounds like a dashboard decision until a real compute marketplace starts failing in production.
A video job times out after the worker claims success. An AI inference request returns late, but the payment is already reserved. A provider with good historical reputation suddenly starts producing bad outputs. The UI still looks fine. The operator does not.
Teams think the problem is sigma computing, BI tooling, or which analytics surface can query the warehouse fastest. The real problem is operational architecture: how compute events, worker signals, validation results, DID identity, payment state, and support workflows become one inspectable system.
That changes the conversation. The practical question is not whether a dashboard can show job volume. The practical question is whether a builder can answer, from a terminal or a warehouse, why a specific job failed, who was responsible, what money moved, and whether the network should trust that worker again.
Table of contents
- Sigma computing is an operations problem, not a dashboard problem
- The reference architecture for sigma computing on job networks
- Model jobs as state machines before modeling charts
- Instrument workers, not just applications
- Sigma computing for payments, settlement, and DID context
- What works: a minimal sigma computing workflow for builders
- What fails in production
- Metrics that actually change operator behavior
- Where c0mpute.com fits
Sigma computing is an operations problem, not a dashboard problem
Sigma computing is usually discussed as a business intelligence workflow: connect data, model metrics, give teams a spreadsheet-like interface, and let operators explore. That is useful, but it is not enough for decentralized compute.
In a decentralized compute marketplace, the data is not just sales, product usage, or infrastructure logs. It is a moving ledger of jobs, bids, workers, proofs, payments, disputes, retries, artifacts, and identity assertions. If those records are not shaped for operations, a dashboard becomes a prettier version of grep.
A useful way to think about it is this: analytics should become the control plane for decisions that humans and automation both understand.
What teams are really trying to see
Builders usually want answers to operational questions:
- Which workers are reliable for FFmpeg transcodes at a given resolution and codec?
- Which inference models are producing the highest retry rate?
- Which customers are stuck in payment-reserved but job-unassigned states?
- Which DID identities are linked to repeated failed validations?
- Which regions, node classes, or providers are causing latency spikes?
- Which support tickets map to the same root cause?
Those are not vanity questions. They affect routing, pricing, trust, refunds, and capacity planning.
The mistake teams make is treating sigma computing as a reporting layer that sits after the system. In compute networks, analytics has to sit inside the operating loop. It should help decide whether to retry, reassign, slash reputation, release escrow, or page a human.
Practical rule: If an analytics view cannot lead to a routing, payment, trust, or support action, it is probably reporting noise.
For a broader take on this same architecture, the earlier c0mpute article on Sigma Computing for Decentralized Compute frames the analytics layer around jobs, workers, payments, and trust rather than generic BI dashboards.
Why decentralized compute makes analytics harder
Centralized cloud systems already produce too much telemetry. Decentralized compute adds three complications.
First, workers are external or semi-external. You do not always control their hardware, local queue, network path, or execution environment.
Second, settlement is part of the workflow. A job is not complete just because an artifact exists. Funds may be reserved, released, disputed, refunded, or delayed.
Third, trust is dynamic. A worker can be healthy for one workload and unreliable for another. A node that handles H.264 transcodes well may be a poor fit for large language model inference. A provider with good uptime may still return invalid outputs.
That means your analytics model must preserve context. Aggregates help, but they cannot erase the individual job trail.
The reference architecture for sigma computing on job networks
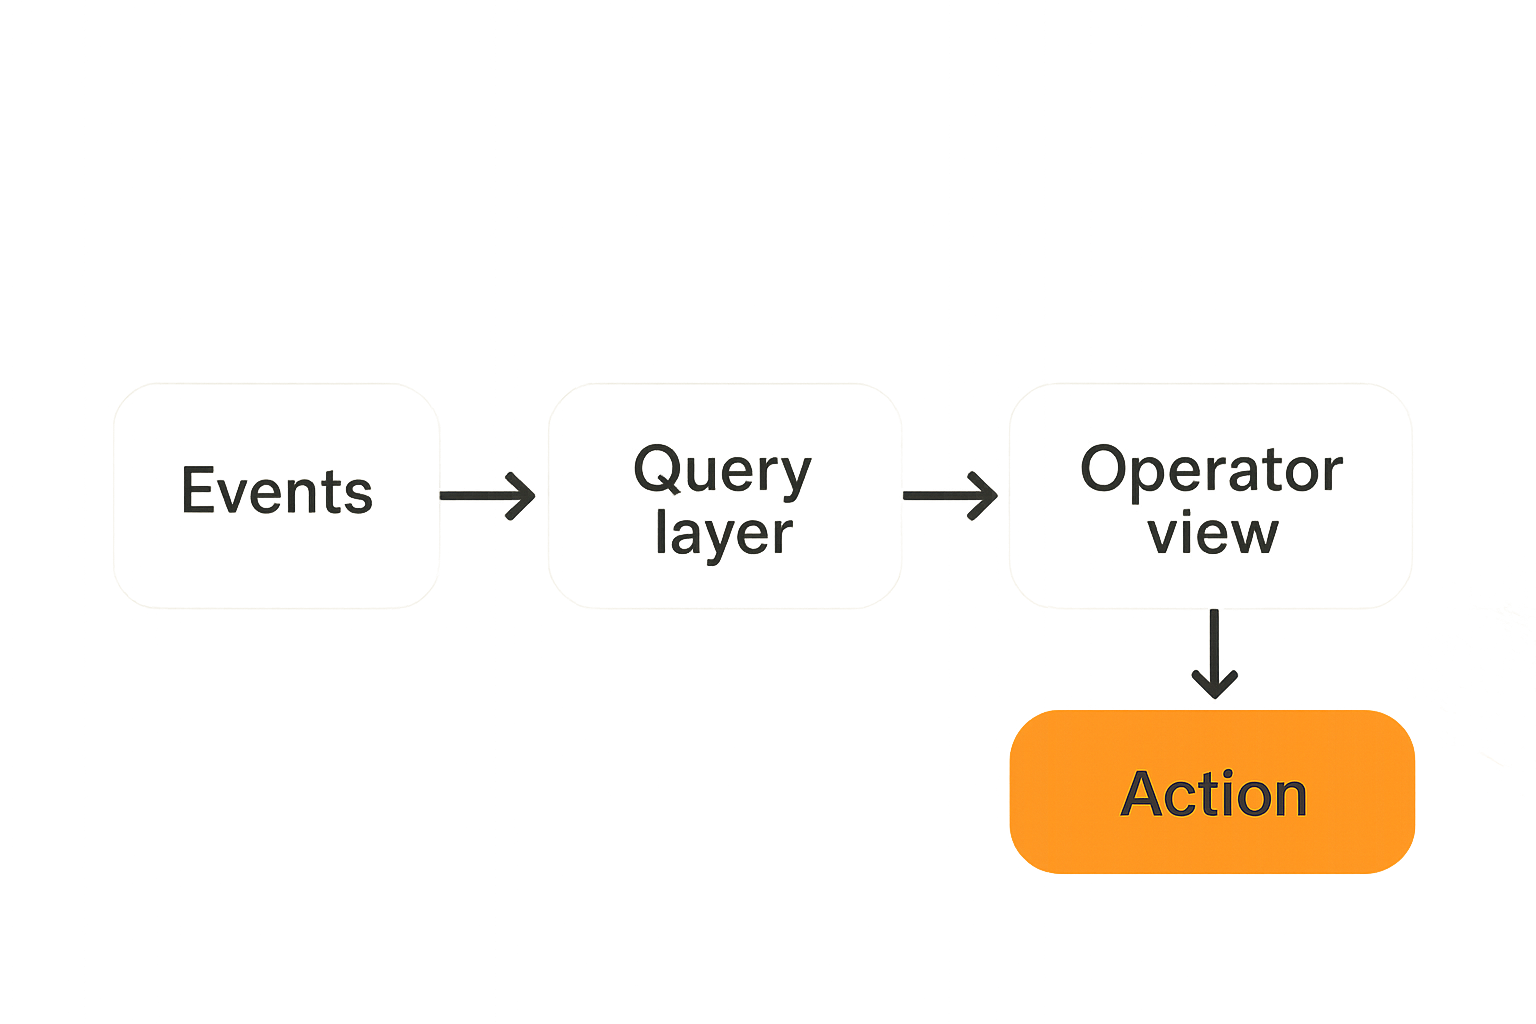
The architecture is simple on paper and easy to get wrong in production. You need an event spine, a query layer, and an operator layer. Each has a different job.
The event spine records what happened. The query layer makes it explorable and joinable. The operator layer turns findings into action.
The event spine
The event spine is the source of truth for operational facts. It does not need to be exotic. It can be Kafka, Redpanda, NATS, Postgres logical events, object storage with append-only logs, or a chain-adjacent event pipeline. The important part is that events are immutable, timestamped, typed, and correlated.
A compute marketplace should emit events like:
- job_created
- bid_submitted
- worker_assigned
- input_fetched
- execution_started
- artifact_uploaded
- validation_passed
- validation_failed
- payment_reserved
- payment_released
- payment_refunded
- dispute_opened
- worker_reputation_updated
Every event needs correlation keys:
- job_id
- worker_id
- requester_id
- did
- quote_id
- payment_id
- artifact_id
- model_id or transcode_profile
- trace_id
Without correlation keys, analytics becomes archaeology.
Practical rule: Do not ship a compute event unless it includes the IDs needed to join it to worker, payment, artifact, and validation context later.
The query layer
The query layer is where sigma computing patterns become useful. You want builders and operators to slice events without filing a ticket every time they need a new view.
The query layer usually needs these tables or models:
| Model | Purpose | Common mistake |
|---|---|---|
| jobs | One row per requested unit of work | Overwriting states instead of preserving transitions |
| job_events | Append-only operational history | Missing correlation IDs |
| workers | Provider identity, capabilities, health | Treating all workloads as equal |
| validations | Proofs, checks, verifier outputs | Storing only pass or fail |
| payments | Quote, reserve, release, refund, dispute | Separating money from job state |
| artifacts | Inputs, outputs, hashes, storage locations | No integrity metadata |
| reputation | Rolling trust by workload type | One global score that hides failures |
This layer can live in a warehouse, lakehouse, Postgres read model, or embedded analytics database depending on scale. The core requirement is not vendor purity. It is joinability.
A query like this should be boring:
select
  j.job_id,
  j.workload_type,
  w.worker_id,
  v.result as validation_result,
  p.status as payment_status,
  j.final_state
from jobs j
left join workers w on j.worker_id = w.worker_id
left join validations v on j.job_id = v.job_id
left join payments p on j.payment_id = p.payment_id
where j.created_at > now() - interval '24 hours'
  and j.final_state != 'completed';
If that query is hard, your operational model is not ready.
The operator layer
The operator layer is where analytics becomes workflow. It can be a BI surface, admin UI, CLI, bot, runbook, or automation engine. The form matters less than the action path.
Good operator workflows answer:
- What happened?
- Is the job recoverable?
- Who or what owns the next action?
- Should funds move?
- Should the worker be trusted for this workload again?
- Can automation safely handle this case next time?
The operator layer should also write back decisions as events. If a human manually refunds a job, reassigns work, or overrides validation, that action belongs in the same event history.
Model jobs as state machines before modeling charts
Most analytics problems in compute marketplaces start with vague states. Completed, failed, and pending are not enough. They compress the most important operational information into labels that cannot drive action.
A decentralized compute job is a state machine. Treat it like one.
A practical job lifecycle
A practical lifecycle for AI inference or FFmpeg transcoding might look like this:
- requested
- quoted
- payment_reserved
- queued
- assigned
- input_available
- running
- artifact_uploaded
- validating
- validation_passed
- payment_released
- completed
Failure states should be explicit:
- quote_expired
- payment_failed
- no_worker_available
- worker_timeout
- input_fetch_failed
- execution_failed
- artifact_missing
- validation_failed
- refund_pending
- disputed
This does not mean every UI must expose every state. It means the system must record them.
For video infrastructure teams, this matters because transcoding failures are often profile-specific. A worker may fail only on 4K HEVC, only when subtitles are burned in, or only when input files come from a slow origin. Related reading from our network: teams building streaming stacks face similar ingest, transcoding, caching, and observability tradeoffs in Cloud Computing IPTV.
What breaks when states are vague
What breaks in practice is ownership. Pending can mean waiting for payment, waiting for capacity, waiting for input download, waiting for validation, or waiting for a human. Each has a different owner.
Vague states create bad automation:
- retries that charge users twice
- refunds before validation finishes
- reassignment while a worker is still uploading
- support tickets with no root cause
- reputation penalties for requester-side input failures
Practical rule: Every terminal state should explain whether the requester, worker, network, payment layer, validator, or operator owns the failure.
That one rule will improve analytics more than another dashboard filter.
Instrument workers, not just applications
In decentralized compute, the worker is the product surface. It is also the biggest operational variable.
If you only instrument the requester API, you will know that jobs are slow. You will not know whether the cause is worker saturation, cold model load, bad input fetch, GPU memory pressure, local disk contention, or network egress.
Worker signals that matter
At minimum, collect worker signals by workload type:
- advertised capabilities
- accepted job classes
- active concurrency
- queue depth
- start latency
- execution duration
- artifact upload duration
- validation pass rate
- timeout rate
- resource hints such as CPU, GPU, memory, disk, and codec support
- version of worker software and plugins
For AI inference, include model load time, token latency where applicable, batch size, memory pressure, and rejected prompts if policy filters exist.
For FFmpeg workloads, include codec, container, bitrate ladder, resolution, filter graph, input duration, output duration, and FFmpeg exit code.
The point is not to collect everything forever. The point is to collect enough to diagnose without SSH access to every node.
Reputation and validation context
A single reputation score is usually too blunt. Workers should earn trust by workload, profile, and validation history.
A useful reputation model might segment by:
- ai_inference:model_family
- ffmpeg_transcode:codec_profile
- storage_artifact:availability
- payment_behavior:settlement_completion
- operator_behavior:dispute_rate
Validation should also be explainable. Validation failed is not enough. Store whether the failure came from hash mismatch, duration mismatch, codec mismatch, model output policy, verifier disagreement, missing artifact, timeout, or manual review.
That changes the conversation from this worker is bad to this worker should not receive 4K VP9 jobs until it passes more validations.
Sigma computing for payments, settlement, and DID context
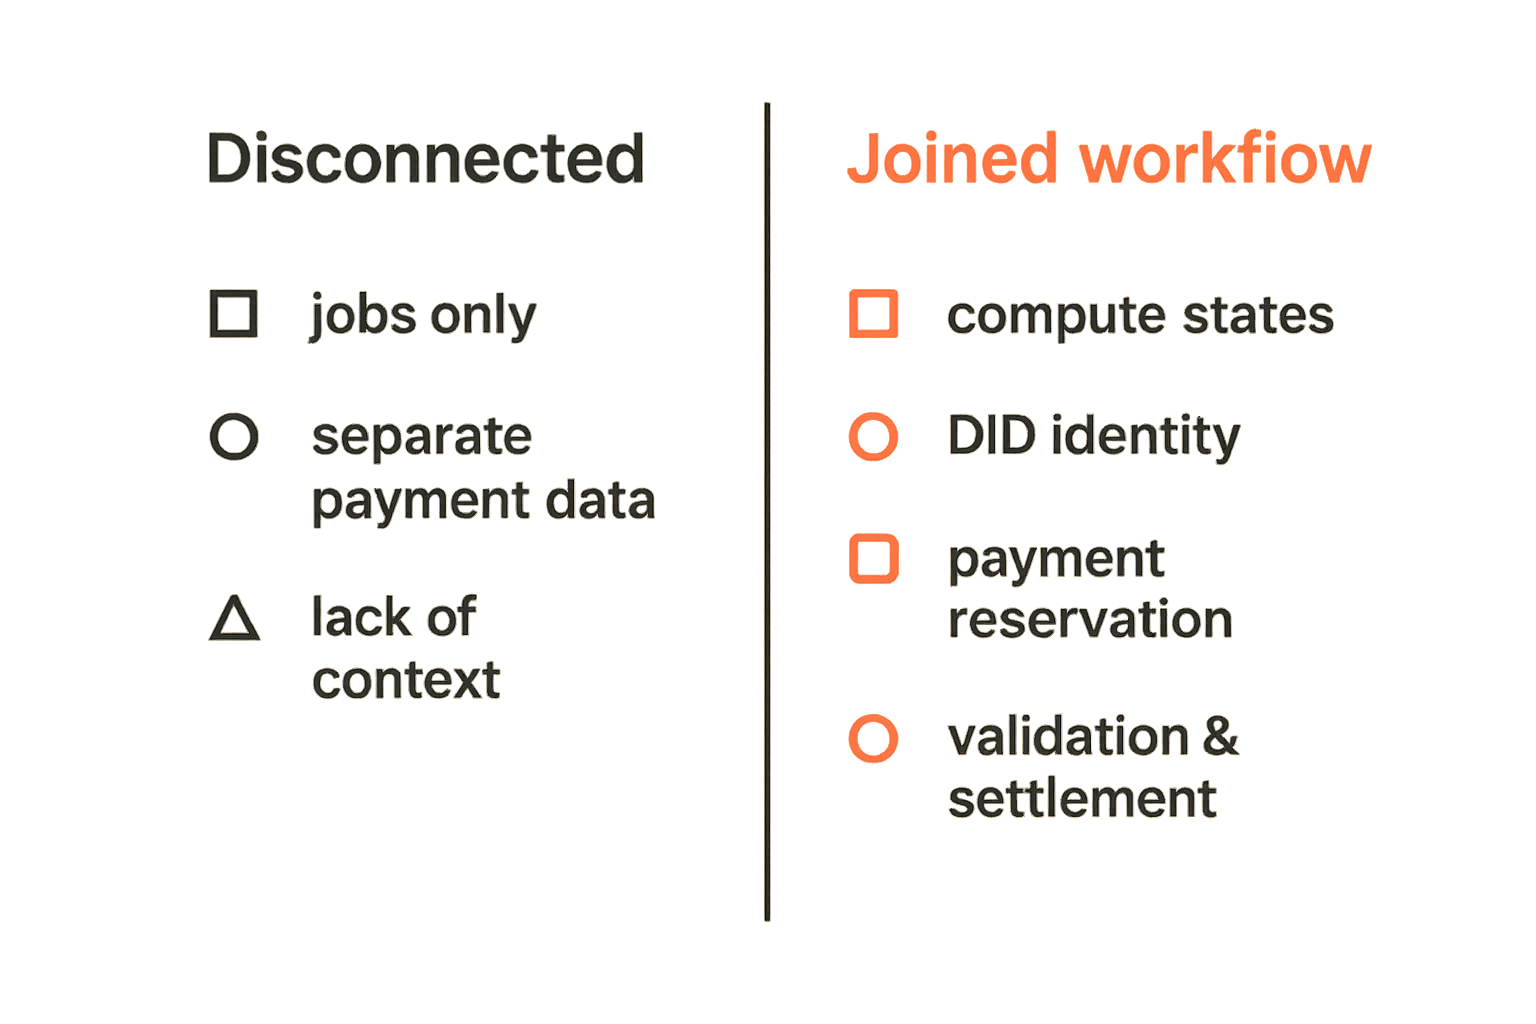
Sigma computing for decentralized compute has to include money and identity. If payments live in a separate system and analytics only sees jobs, operators will make decisions with half the state missing.
This is especially true when DID-based identity, escrow-like flows, or crypto settlement are involved. The compute result, the payment state, and the identity context are one workflow.
Link compute events to payment events
A job should not be analyzed without its payment timeline. At minimum, record:
- quote_created
- quote_accepted
- payment_reserved
- reservation_expired
- payment_released
- refund_requested
- refund_completed
- dispute_opened
- dispute_resolved
Then join those events to job states.
For example, payment_reserved plus no_worker_available is a capacity problem with a customer impact. validation_failed plus payment_reserved is a refund or dispute workflow. artifact_uploaded plus payment_not_released is a settlement issue. Each case needs a different runbook.
The mistake teams make is designing checkout first and reconciliation later. Compute marketplaces cannot afford that. Settlement is not a back-office concern; it is part of job state.
Related reading from our network: the same pattern appears in biotech compute payments, where quotes, job states, escrow, webhooks, and settlement have to be modeled together in Cloud Computing Peptide Payments.
Keep custody boundaries visible
Analytics should show custody boundaries clearly. Operators need to know whether funds are held by the platform, a smart contract, a payment processor, a wallet, a merchant account, or not held at all.
A simple table helps:
| Payment state | Compute state | Operator interpretation | Typical action |
|---|---|---|---|
| not_started | requested | No financial obligation | Ask requester to confirm quote |
| reserved | queued | Customer committed, capacity needed | Prioritize assignment or expire quote |
| reserved | validation_failed | Money held, result not accepted | Refund, dispute, or re-run |
| released | completed | Normal closeout | Archive evidence |
| released | disputed | Risk event | Freeze reputation changes until review |
| refunded | worker_completed | Potential worker compensation issue | Review validation and policy |
DID context adds another layer. You may want to know whether the requester DID, worker DID, payout address, and reputation subject are the same entity or linked entities. Do not flatten that too early.
What works: a minimal sigma computing workflow for builders
You do not need a huge data platform to start. You need a disciplined event model and a workflow that makes failures inspectable.
The practical question is what to build first.
Implementation sequence
A minimal implementation sequence looks like this:
- Define job states before dashboards. Write the allowed transitions and terminal states.
- Emit append-only events for every transition. Include correlation IDs on every event.
- Store raw events before transforming them. Keep the original payloads for replay and audits.
- Build read models for jobs, workers, validations, payments, and artifacts.
- Create operator queries for stuck jobs, failed validations, unpaid completions, and worker degradation.
- Add CLI commands that inspect a single job and explain the timeline.
- Add automation only after the manual runbook is reliable.
- Feed validated outcomes back into reputation and routing.
That order matters. If you automate before the state model is clean, you will automate confusion.
Practical rule: Build the single-job investigation path before building aggregate dashboards. Operators debug incidents one job at a time.
Example schemas and CLI checks
A small event schema can go a long way:
create table job_events (
  event_id text primary key,
  job_id text not null,
  event_type text not null,
  worker_id text,
  requester_id text,
  did text,
  payment_id text,
  artifact_id text,
  workload_type text not null,
  event_time timestamptz not null,
  payload jsonb not null
);
Then build a CLI inspection path:
c0 job inspect job_8fd3 --timeline
c0 job inspect job_8fd3 --payments
c0 worker inspect worker_41a --workload ffmpeg:h264_1080p
c0 reputation explain worker_41a --since 7d
The output should be boring and actionable:
job_id: job_8fd3
state: validation_failed
owner: worker
payment: reserved
next_action: reassign_or_refund
reason: output_duration_mismatch
worker: worker_41a
profile: ffmpeg:h264_1080p
If your operator cannot get that answer quickly, the analytics layer is not doing its job.
What fails in production
Most failures are not caused by the absence of analytics. They are caused by analytics that is disconnected from the system it is supposed to operate.
A dashboard can show a spike. It cannot fix a broken state model.
Dashboard-first analytics
Dashboard-first analytics usually fails in four ways.
First, it optimizes for aggregates before investigation. Teams can see total failures, but cannot explain one failed job.
Second, it hides state transitions. The current status overwrites the path that produced it.
Third, it separates operational domains. Jobs are in one table, payments in another tool, workers in logs, and disputes in support software.
Fourth, it creates passive viewers instead of operators. People look at charts, then switch to terminals and databases to do the real work.
What works is the reverse: start with the runbook, then build views that shorten the runbook.
Orphaned webhooks and retries
Webhooks and retries are where clean diagrams go to die.
A payment webhook arrives twice. A worker uploads an artifact after timeout. A validator reports failure after a retry has already succeeded. A requester cancels while funds are reserved. A support operator manually refunds while automation is still processing.
If events are not idempotent, correlated, and ordered well enough for your business rules, sigma computing will only reveal the mess after customers feel it.
Use these patterns:
- idempotency keys for job creation, payment reservation, artifact upload, and settlement
- monotonic state transitions with rejected invalid transitions
- replayable event consumers
- dead-letter queues with operator ownership
- timeout events that are explicit, not inferred only by queries
- manual actions recorded as first-class events
Related reading from our network: answer-engine and crawler-facing cloud sites face a similar measurement problem, where performance, schema, validation, and observability need to line up before AI systems can reliably cite the source in Cloud Computing Answer Engine Optimization.
Metrics that actually change operator behavior
Metrics should change what the system does. If nobody would route differently, price differently, retry differently, or investigate differently after seeing a metric, it is probably not a control metric.
For decentralized compute, the best metrics connect demand, execution, validation, payment, and trust.
Marketplace health metrics
Useful marketplace metrics include:
- job acceptance rate by workload
- time to first bid
- time to assignment
- worker supply by capability
- queue depth by workload
- validation pass rate by profile
- retry rate by failure owner
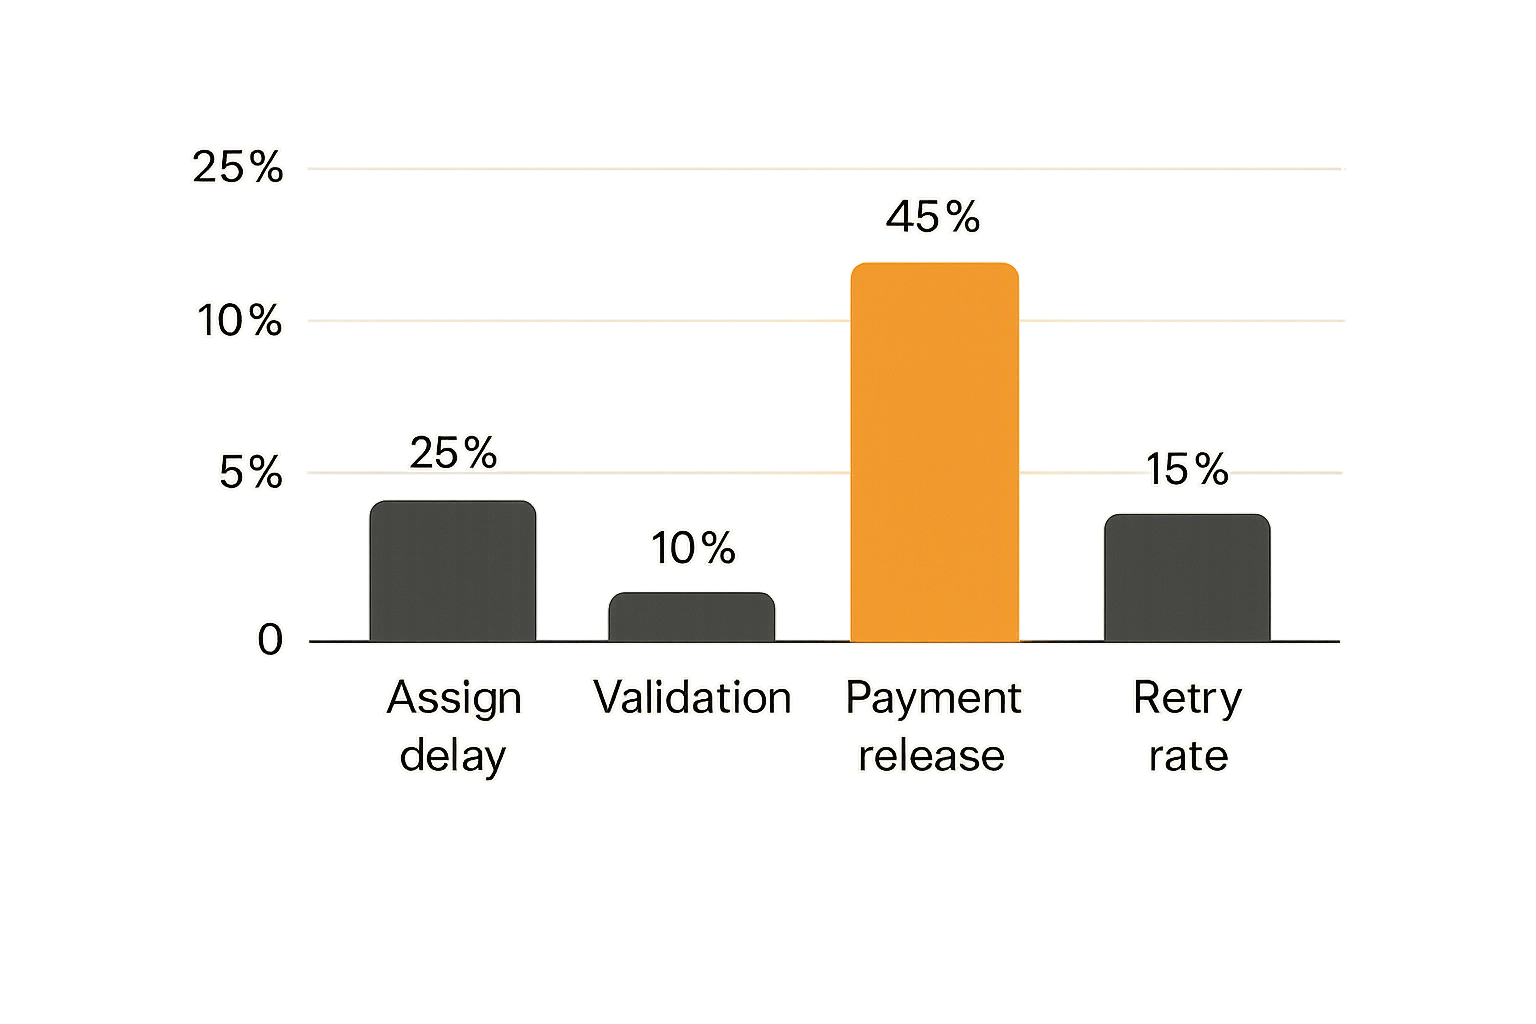
- payment release latency
- dispute rate by workload and worker cohort
- artifact availability after completion
A few ratios matter more than raw counts:
| Metric | Why it matters | Bad interpretation to avoid |
|---|---|---|
| accepted jobs divided by requested jobs | Shows whether supply matches demand | Treating low demand and low supply as the same problem |
| validation pass rate by workload | Separates capacity from quality | Averaging all workloads together |
| payment release latency | Shows settlement friction | Blaming workers for payment bottlenecks |
| retry success rate | Shows whether retries are useful | Retrying all failures blindly |
| dispute rate after release | Shows trust and evidence quality | Assuming completed means accepted |
The mistake teams make is measuring only throughput. Throughput without validation and settlement is just motion.
Per-job investigation metrics
Per-job metrics shorten incident time. They should be visible in the job timeline:
- quote age
- queue wait
- assignment delay
- input fetch time
- execution time
- artifact upload time
- validation time
- payment release time
- number of retries
- number of workers attempted
- current owner
These metrics help answer the operator question: where did the job spend time, and who owns the next step?
For AI infrastructure builders, this is the difference between saying inference is slow and knowing that model load time is fine, queue wait is high, and validation is the bottleneck. For video engineers, it is the difference between blaming FFmpeg and seeing that artifact upload dominates completion time.
Where c0mpute.com fits
c0mpute.com is built around the assumption that decentralized compute is an operator workflow, not just a marketplace listing page. The useful surface is not only where a requester submits a job. It is where builders inspect identity, execution, artifacts, validation, payment state, and worker trust.
That is why a CLI-first approach matters. Developers need to script, inspect, replay, and integrate the workflow without waiting for a dashboard to expose every edge case.
A CLI-first path for compute analytics
For builders working with decentralized AI inference, FFmpeg transcoding, and DID-based payments, the analytics model should be close to the command line.
A practical local loop looks like this:
c0 identity create
c0 transcode submit input.mp4 --profile h264_1080p
c0 job inspect latest --timeline
c0 infer run llama-small --input prompt.txt
c0 worker list --capability ffmpeg
c0 health check
The exact commands depend on implementation, but the principle is stable: every job should be inspectable from creation through settlement.
The c0mpute docs are the right place to start when you want the CLI reference, worker setup flow, transcode jobs, AI inference commands, reputation concepts, plugins, and health checks in one place.
Build versus rent versus federate
Not every team should build a complete analytics stack from scratch. The right choice depends on control requirements.
| Approach | Best fit | Tradeoff |
|---|---|---|
| Build internal read models | Teams with custom protocols and strict control | More engineering ownership |
| Use BI on warehouse models | Teams that already centralize events | Risk of passive dashboards |
| Federate marketplace events | Teams integrating multiple compute networks | Harder identity and schema normalization |
| CLI-first operational analytics | Builder teams debugging real jobs | Requires disciplined event design |
A useful way to think about it is ownership. If your team owns routing, settlement, and reputation, it must own the event model. Tools can help query it, but they cannot define what a valid compute state means for your marketplace.
Sigma computing is valuable when it sits on top of that discipline. Without it, the warehouse becomes a pile of disconnected facts. With it, operators can see the compute network as a living system: demand, workers, validation, money, and trust.
Try c0mpute.com
c0mpute.com is for technical builders interested in decentralized compute, AI inference, FFmpeg transcoding, and DID-based payments. If you are designing sigma computing workflows around real jobs instead of static dashboards, Try c0mpute.com.